Lotus@Runtime: A Tool for Runtime Monitoring and Verification of Self-adaptive Systems
17 Jan 2017Lotus@Runtime is an extensible tool that uses models@runtime to monitor and verify self-adaptive systems. The tool monitors the execution traces generated by a self-adaptive system and annotates the probabilities of occurrence of each system action on their respective transition on the system model, which is represented by a Probabilistic Labelled Transition System (PLTS) model. Then, runtime checks of a set of reachability properties are performed against the updated model. If a property is violated, the self-adaptive system can be informed by a notification mechanism provided by Lotus@Runtime.
In Lotus@Runtime, an adaptation flow, illustrated in Figure below, starts by monitoring the execution trace generated by a self-adaptive system. The traces are captured during the monitoring phase by the MonitorComponent. Then, during the model update process, the LotusModelComponent calculates the probabilities of each transition and updates the model with the new probabilities at runtime. After, the ModelCheckerComponent performs runtime checks of the user-defined properties against the updated probabilistic software behavior model. If a property is violated, then NotifierComponent triggers a notification about that violation. Regardless of whether or not a violation occurs, the monitoring process should keep running continuously. To receive the violations that may occur, developers must implement the interface ViolationHandler at the planning phase. Otherwise, the notifications will be lost.

Dependencies
Lotus@Runtime requires the following dependencies:
Download and Setup
Direct links to download the Lotus@Runtime source code and the exemplars:
Instructions to run Lotus@Runtime + TAS
Download the exemplars workspace and open it using Eclipse IDE. The TAS main class (MainGui.java) is located on the TAS_gui project.
Instructions to run Lotus@Runtime + TPA
Download the exemplars workspace and open it using Eclipse IDE. The TPA main class (MainGui.java) is located on the travelapp_gui project.
Tele Assistance System (TAS)
The Tele Assistance System is a service-based system that provides health support to chronic condition sufferers within the comfort of their homes 1. In the original concept, the TAS uses a wearable device to take periodical measurements of the patient’s vital parameters and analyze them through medical services. After the analysis, the result may trigger the invocation of an alarm service to call an ambulance, or the invocation of a pharmacy service to deliver medication to the patient’s house.
The system is composed of the following three abstract services:
- Alarm Service, which triggers the alarm and calls the first-aid squad (ambulance).
- Medical Analysis Service, which analyses the patient’s vital parameters.
- Drug Service, which requests a medicine replacement or changes its dosage.
To configure the Lotus@Runtime in the TAS, we have adopted the strategy to monitor new traces of every change in the log file, and created the two following quality of service requirements:
- (P1) the probability of a failure after the alarm service should be less than 20%, represented by reaching state 5 from state 0.
- (P2) the probability of a failure after the pharmacy service should be less than 10%, represented by reaching state 11 from state 0.
The probabilistic LTS model, as illustrated in the figure below, was created using the LoTuS tool and represents the system behavior with their services. The model is based on the DTMC model presented by 2.

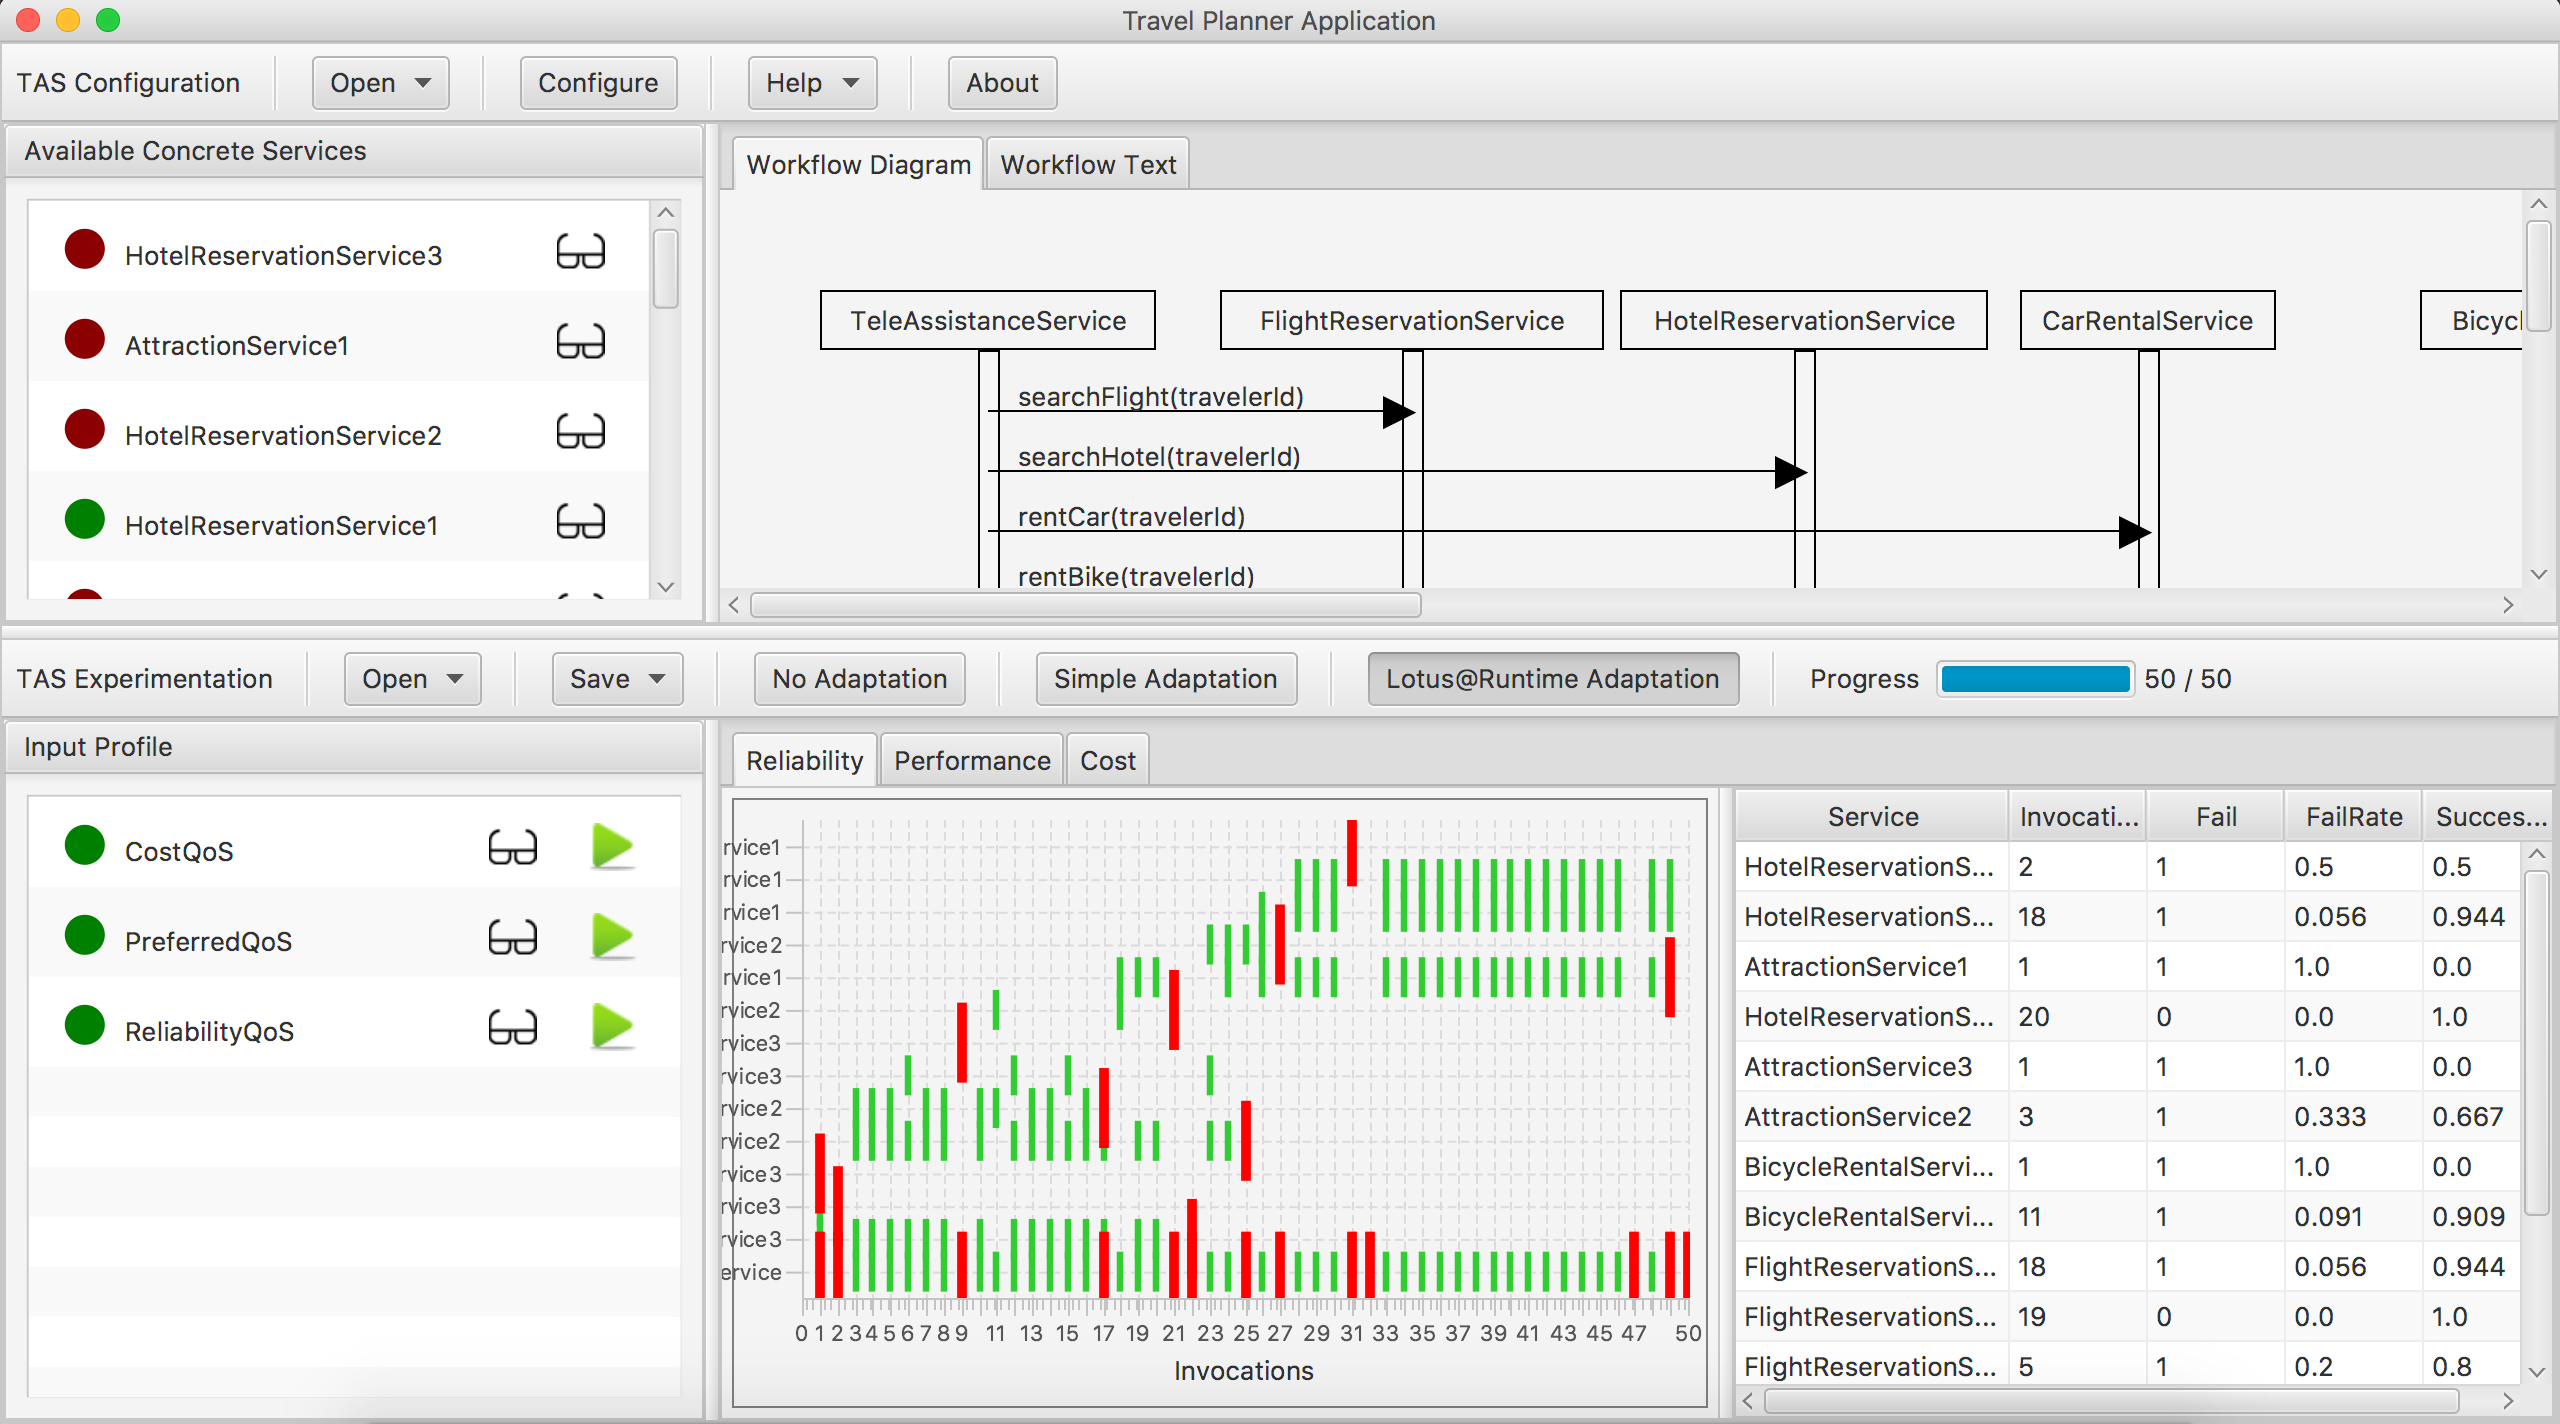
Travel Planner Application (TPA)
The Travel Planner Application is a service-based system that provides services to search for flights, tourist attractions, accommodation arrangements, and rental cars or bicycles. The application is composed of the following five services:
- Attraction information service, which searches for tourist attractions.
- Flight reservation service, which searches for available flights.
- Hotel reservation service, which seeks hotels and makes reservations.
- Bicycle rental service, which allows renting bikes.
- Car rental service, which allows renting cars.

The TPA model is illustrated in the Figure above, which was based on the DTMC model, available on COVE (COntinual VErification) framework 2. The three following quality of service requirements:
- (P1) the probability of a failure after the flight reservation service should be less than 15%, represented by reaching state 5 from state 0.
- (P2) the probability of a failure after the hotel reservation service should be less than 10%, represented by reaching state 7 from state 0.
- (P3) the probability of a failure after the attraction information service should be less than 20%, represented by reaching state 3 from state 0.
Step-by-Step Instructions
TAS/TPA Configuration Panel
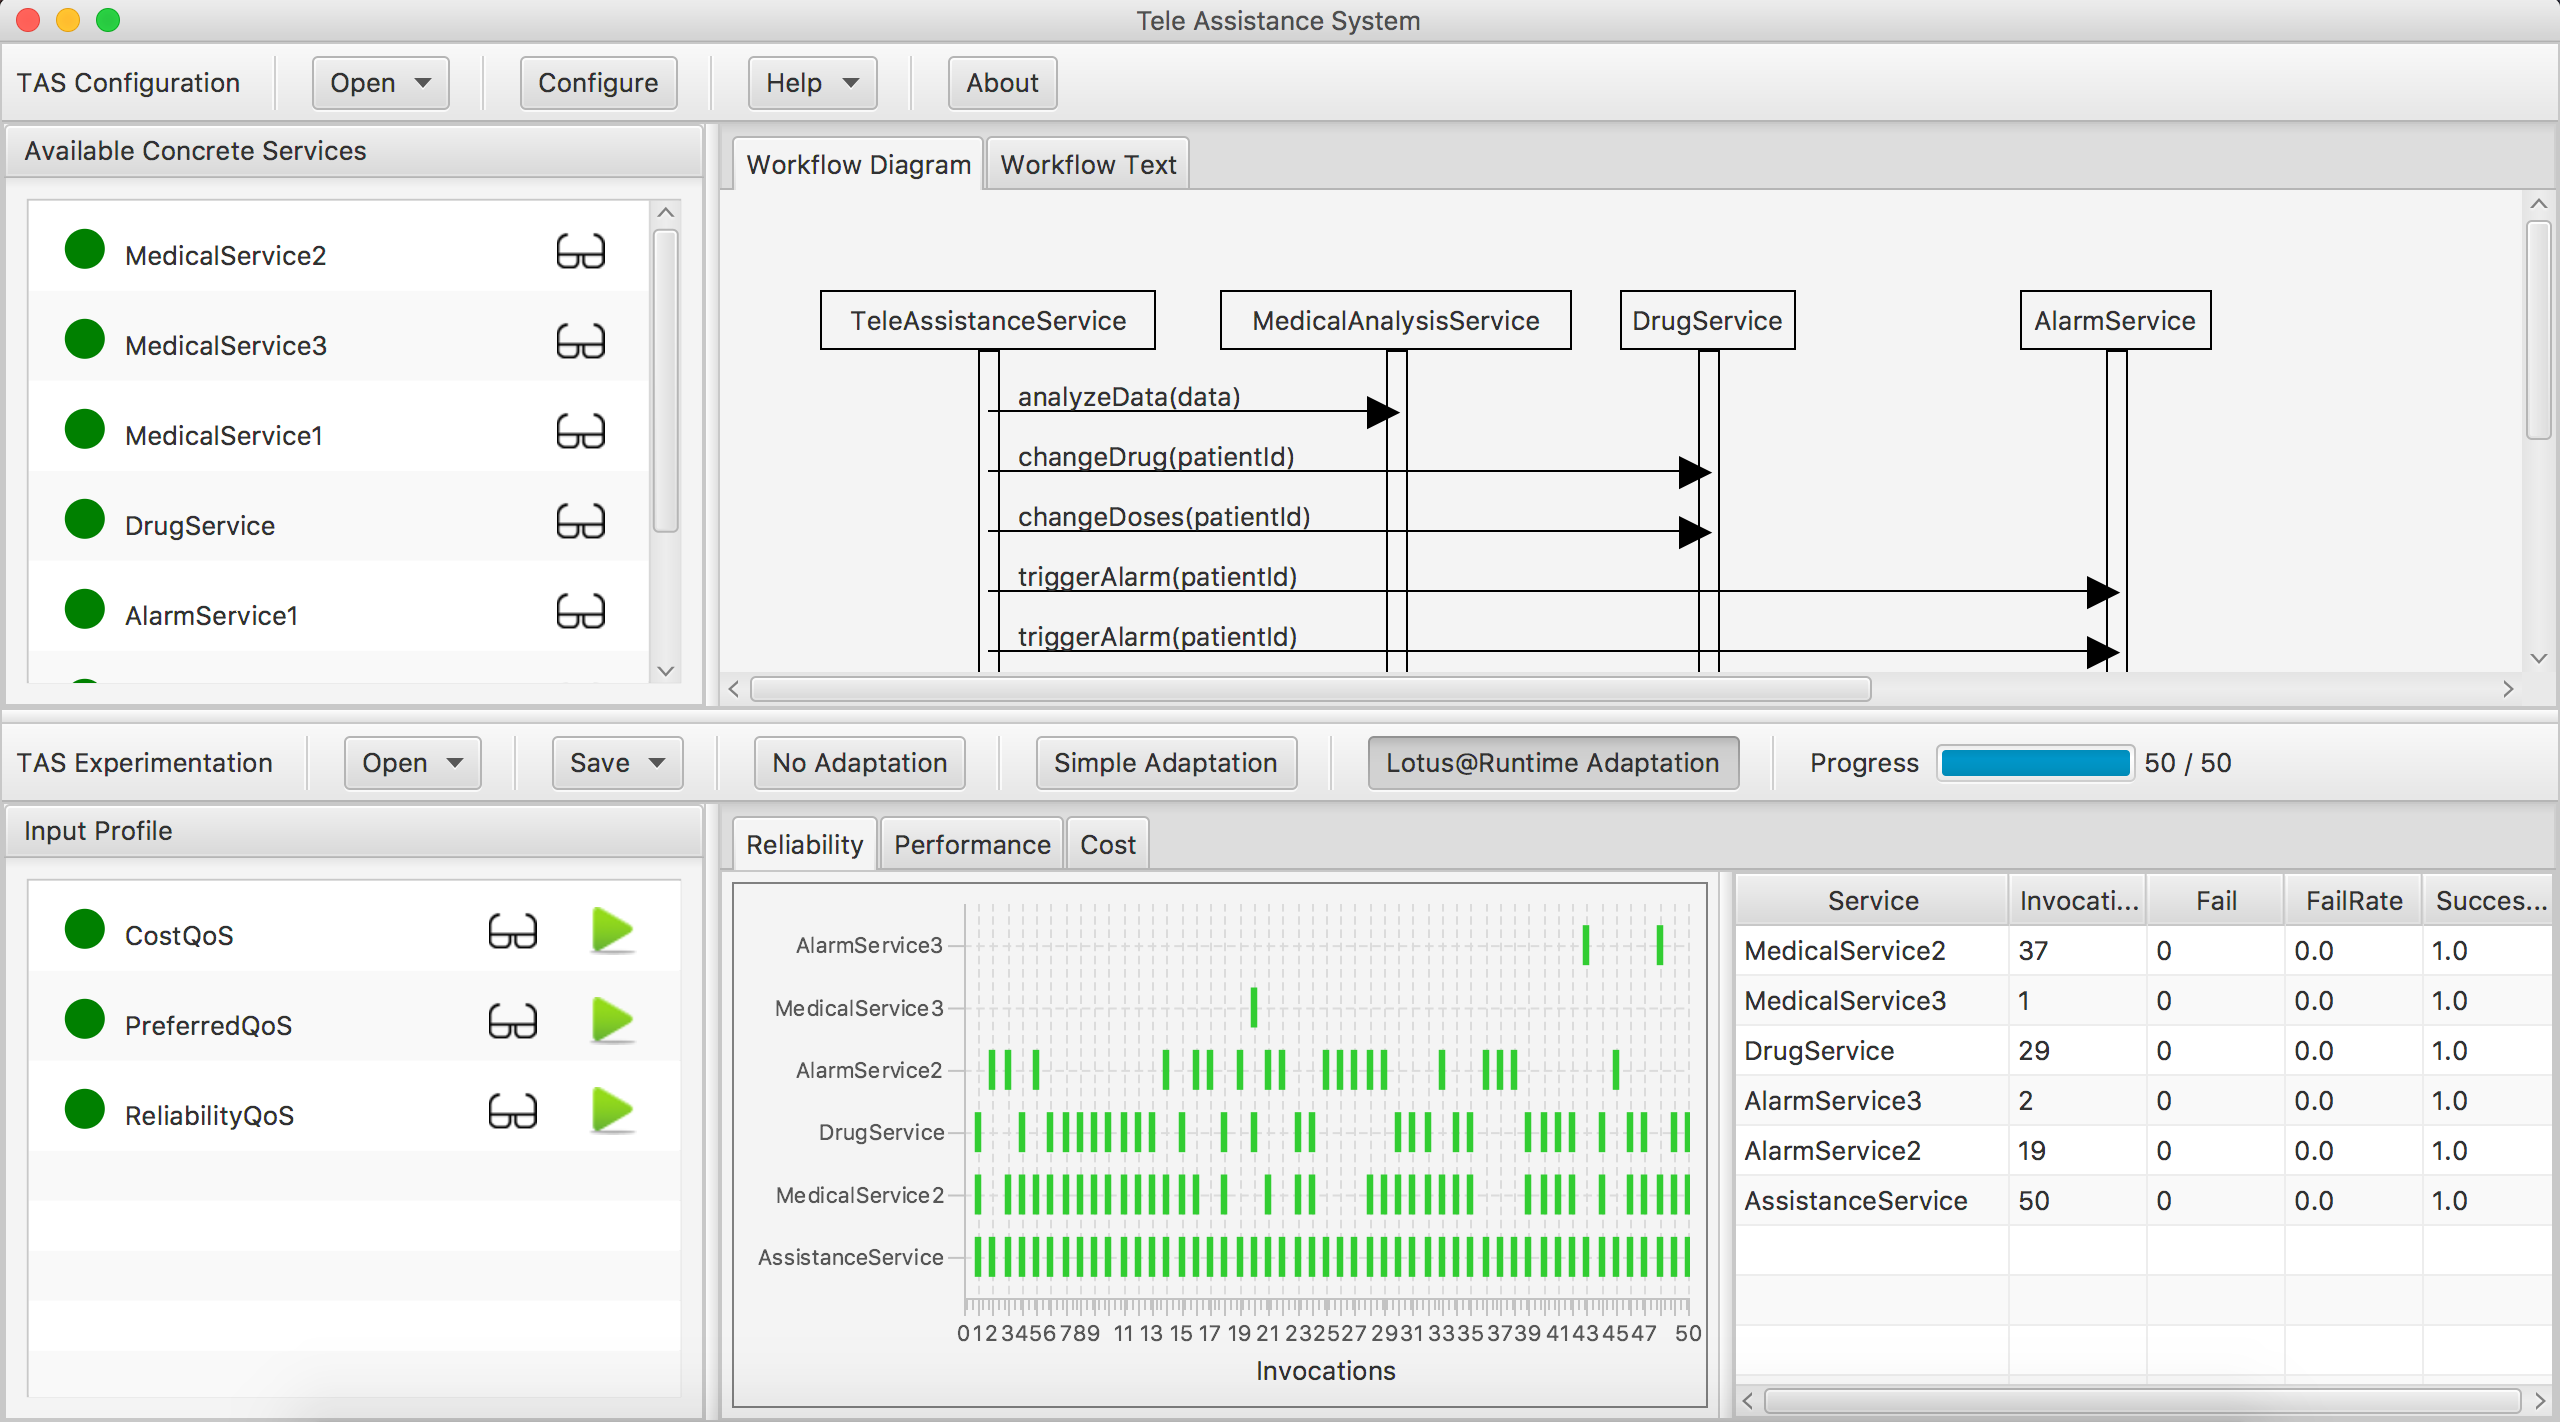
The left panel shows the concrete services that are available. A green mark means the workflow uses the service; a red mark means that the service is not used by the workflow. The glasses symbols allow inspecting the service description as well as the service profile of each service and adapting the parameters dynamically.
The right panel shows the definition of the TAS workflow. Both a graphical representation and a specification with the ReSeP workflow definition language are available.
TAS/TPA Configuration Bar
The Open button allows opening a workflow (Open Workflow item). The Configure button allows dynamic configuration of the behavior of the underlying ReSeP platform. Message loss and communication delay can be defined, as well as the real-time that matches with a logic time unit in the system.
TAS/TPA Experimentation Panel
The left panel shows the input profile that can be used to test the loaded configuration (i.e., workflow with available concrete services). A green mark means that the profile is available but currently not executed; a red mark means the profile is executing. The glasses symbols allow inspecting the input profiles and adapting the parameters dynamically. Both a text and table are available. The green triangle buttons on the right-hand side are used to run the corresponding input profile (parallel runs are not supported). Clicking the red mark stops the execution of the running input profile.
The right panel shows three graphs with tables. When the execution of the input profile completes, the results will be shown in the graphs and overview tables. The Reliability graph shows on the X-axis the series of invocations of the assistance service and on the Y-axis the concrete services that were invoked. Short green vertical lines indicate that invocations were successful; longer red vertical lines indicate failed invocations. The Performance graph shows on the X-axis the invocations of the assistance service and on the Y-axis the response time of the concrete services that were invoked. The subsequent service executions are represented with stocked collared bars. Finally, the Cost graph shows the accumulated cost for the invocations performed by the input profile. The tables summarize the results.
TAS/TPA Experimentation Bar
The Open button allows opening new input profiles (Open Profile item), open the results of an earlier run stored in CSV format (Open Available Services item), and open the log (Open Log). For the latter, log items can be ordered based on different criteria and the log can be filtered based on time and type.
The Save button allows saving the results of a run (Save Run) as a CSV file, the current log (Save Log) as a CSV file, the graph of the current reliability chart in png format (Save Reliability Graph), the graph of the current performance chart in png format, and the graph of the current cost chart in png format (Save Cost Graph).
The buttons No Adaptation and Simple Adaptation allow you to select between the execution of services invocations without and with adaptation. Simple Adaptation removes failed services from the set of available services.
The progress bar shows the progress of an ongoing execution of an input profile.
More Information
You can check more information at the following links:
- http://drops.dagstuhl.de/opus/volltexte/2017/7145/
- https://ieeexplore.ieee.org/document/7968129